2017 Highlights
May 19, 2017 - Social Media and Demographic Methods Workshop
September 22, 2017 - CPD Annual Meeting and Annual Report
December 13-15, 2017 - PopDataViz2017
On May 19, 2017 the CPD hosted a training workshop for Social Media and Demographic Methods. Workshop Instructor Emilio Zagheni provided attendees with a hands-on experience, learning practical skills for applying demographic methods to social media data.
On September 22, 2017, the CPD released the 2016-2017 Annual Report. In it the major achievements of the year are described. These include another successful Social Statistics and Population Dynamics weekly seminar series which featured 19 speakers, a popular training workshop on Social Media and Demographic Methods, and a multidisciplinary conference organized by CPD members at McGill, entitled Global Need for Formal Child Care. The annual report also highlights upcoming plans which will focus on more training initiatives in partnership with co-sponsors. An extensive list of CPD member and student publications is also provided, showcasing the work of those involved in the CPD.
On December 13-15, 2017, the CPD held a three-day, hands-on, interactive training workshop: PopDataViz2017. The workshop included:
- Training topics: Data visualization basics, making plots, working with grouped data, geoms and models, and drawing maps using the open source statistical software R
- Lunch lecture: Data visualization and the UN Data revolution
- Panel discussion: The Good, the Bad and the Ugly of data visualization for population research
- Hack-a-thon/Dragon’s Den feedback session on select data visualizations (Optional)
- Expert perspectives: McGill population research and computer science researchers and professionals from Statistics Canada, McGill Media Relations and McGill Graphic Design .
- Multidisciplinary participants from social science and health population research fields
- Multiple networking opportunities
PopDataViz2017 was spearheaded by the Centre on Population Dynamics (CPD) in collaboration with the Centre for Social and Cultural Data Science (CSCDS). Using a partnership, intersectoral and interdisciplinary approach, PopDataViz2017 was financed through funding from a SSHRC Connection grant and co-sponsorship by 12 partnering units at four institutions: UQAM (Groupe de recherche sur le capital humain de l'ESG), Université de Montréal (Départment de démographie and Quebec inter-University Centre for Social Statistics (QICSS)), Statistics Canada, and McGill University (Eight units - Centre on Population Dynamics, Centre for Social and Cultural Data Science, Centre for the Study of Democratic Citizenship (CSDC)/ Centre pour l'étude de la citoyenneté démocratique(CÉCD), Department of Epidemiology, Biostatistics, and Occupational Health Institute for Health and Social Policy (IHSP), Institute for the Study of International Development (ISID), McGill Observatory on Health and Social Services Reform and Office of Innovation and Partnerships).
PopDataViz2017’s 41 participants reflected the full range of interdisciplinary, cross-sectoral, and professional diversity of these 13 partners and included 5 Statistics Canada analysts, 6 faculty members, 4 Research Associates, 2 data librarians, 2 postdocs, 5 Master’s students, and 17 PhD students from Bio Ethics, Computer Science, Demography, Economics, Epidemiology, Library Science, Management, Nutrition, Public Health, Political Science, Psychiatry, and Sociology.
Final program: ![]() 2017-12-11-popdataviz-final-agenda.pdf
2017-12-11-popdataviz-final-agenda.pdf
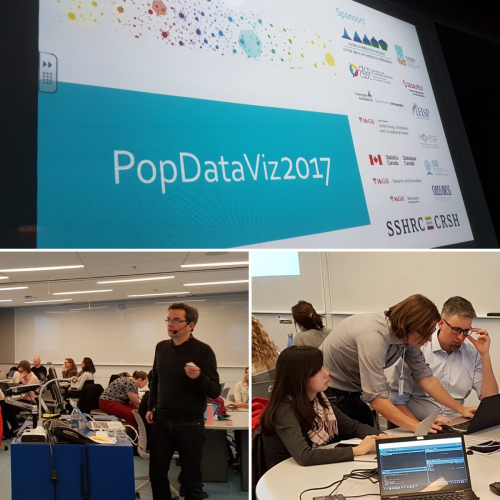
Above: Instructor Professor Kieran Healy - 15 hours of hands-on data visualization instruction using R (Bottom-left);

Above: Lunch hour presentations: The Good, the Bad and the Ugly of data visualization for population research. Jean-Bernard Ng Man Sun, Art Director. McGill Graphic Design - Communications and External Relations; Marc Lachance, Director - Social and Aboriginal Statistics Division, Statistics Canada; Thomas Soehl, Assistant Professor, Sociology, McGill University; Cynthia Lee, Senior Communications Officer, McGill Media Relations Office

Hack-a-thon participants receiving feedback from the four "Dragons": Derek Ruths, Computer Science, McGill University; Jean-Bernard Ng Man Sun, Art Director, McGill Graphic Design and Marc Lachance, Statistics Canada, and Cynthia Lee, Senior Communications Officer, McGill Media Relations Office.
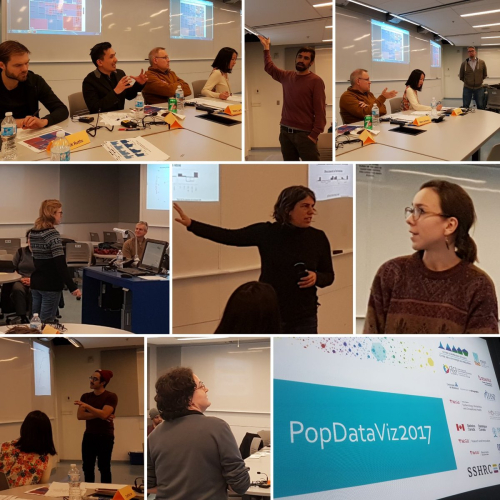
Hack-a-thon participants' presentations of their final data visualizations to the Dragons during Dragons' Den session
PopDataViz proof-of-concept infographic
Click on image to enlarge. Data viz resource page here.


