Course evaluations are open!
Winter 2026 deadlines:
- April 14 (condensed evaluation period)
- May 1 (default evaluation period)
Winter 2026 deadlines:
This page contains a summary of the Guidelines and Recommendations for the Interpretation of End-of-Course Evaluation Results [.pdf].
Course evaluation results are one input to an ongoing reflective process that instructors should engage in to improve their teaching and future offerings of courses. The information that students provide, especially the comments, can be useful in identifying areas where changes and modifications have been effective, and those that still require attention.
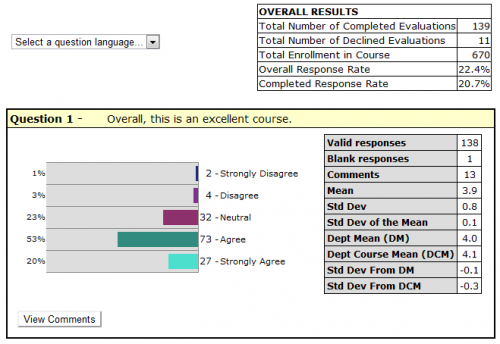
The number of students who submitted the evaluation.
The number of students who declined the evaluation.
The number of students enrolled in the course.
The sum of the “Total Number of Completed Evaluations” and the "Total Number of Declined Evaluations," divided by the “Total Enrollment in the Course or Course Section," expressed as a percentage.
The “Total Number of Completed Evaluations” divided by the “Total Enrollment in the Course or Course Section," expressed as a percentage.
The number of students who selected one of the options provided for the question.
The number of students who did not select an option for the question. Blank responses are NOT included in any calculations. Note: The number of “Valid responses” plus the number of “blank responses” should equal the “Total Number of Completed Evaluations”.
The number of students who entered a comment for the question.
The sum of all “valid responses” divided by the number of “valid responses”. Note: The closer the mean is to 5, the closer it is to “strongly agree/ excellent”.
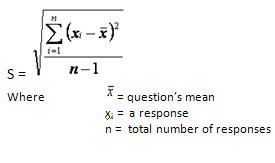
The standard deviation is a measure of the variation of the distribution of a data set. The standard deviation provides information about the distribution of responses, and underlines the danger of looking at the mean alone without considering the variance.
Formula: The standard deviation is calculated as the square root of the arithmetic mean of the squares of the deviation from the arithmetic mean. As this is a calculation on a sample rather than the population, the result is an estimated standard deviation and is expressed in the same units as the data.
Why look at the Standard Deviation?
For example, the following three cases illustrate how the same mean, 3, summarizes three data sets with completely different features. Clearly, the estimated standard deviation is needed in conjunction with the sample mean to better describe a data set.
| Case 1 | Case 2 | Case 3 |
Student responses: 5 x “1” and 5 x “5”
|
Student responses: 2 x “1”, 2 x “2”, 2 x “3”, 2 x “4” and 2 x “5”
|
Student responses: 10 x "3"
|
This is an estimate of how representative the sample mean (those responding to the questionnaire) is of the population mean (the whole class).
Formula: The variability of the sample mean is, naturally, smaller than the variability in the individual observations. This is usually taken to be the estimated standard deviation of the observations, divided by the square root of the sample size. When sampling from a “small” finite population this variability will be reduced. A finite population estimator of the standard deviation of the sample mean is given by:
This is the mean calculated treating all courses as if they were combined into one. It is the sum of all valid responses for a question in all courses in the department divided by the total number of such responses.
This is calculated as the “mean of means” and gives equal weight to mean evaluations from classes of different sizes. For this mean, the sum of the mean for each question per course is divided by the number of courses. It is calculated to avoid any weighting due to large courses in a department but perhaps gives undue weight to mean evaluations reported for classes with very small enrolments.
The decision about which mean to use depends on the course size and number of respondents. The Dept. Mean is more commonly used when there is little difference (+-.1) between the two means. This usually occurs when courses within a department have relatively uniform enrolments and there are similar response rates for all courses.
However, a range of course sizes or number of respondents within a department usually results in differences between the two means. Therefore, to compare like to like, large courses should be compared to the Dept Mean and small courses to the Dept Course Mean.
For example, Dept X has enrolments ranging from 6 to 400. For a given semester, the question, “Overall, this is an excellent course,” gives a Dept Mean of 3.4 and a Dept Course Mean of 3.7.
Case 1
Prof. A is teaching a course of 28 students and received 15 responses (53.6% response rate). The result for this question was a mean of 4.1, σ 0.9. To compare to similar smaller courses, the Dept Course Mean should be used, as this removes the weighting due to the number of students in large classes.
Case 2
Prof. B is teaching a course with 400 students and received 149 responses (37.3% response rate). The result for this question was a mean of 3.2, σ 1.0. To compare to similar large courses, the Dept Mean should be used, as this removes the weight of courses with small enrolments.
When using course evaluations to improve and enhance your teaching, numerical results are most useful for identifying strengths and weaknesses while comments provide insights for reflection. When looking at the results it is important to consider the following:
(e.g., “Overall this instructor is an excellent teacher”; “I learned a great deal from this course”). Responses to these questions are found to correlate most consistently with measures of actual student achievement. Generally, results below 3.5 should be of concern, while 3.5 to 4 represent solid results, and mean scores over 4 are considered strong. As well, it is advisable to follow-up on any result that is more than .5 below or above the comparison mean (department, Faculty by level or class size).
| Rating | Meaning (in general) |
|---|---|
| < 3.5 | Of concern |
| 3.5 - 4 | Solid |
| > 4 | Strong |
When interpreting the numerical results, consider information such as the distribution of responses by item as well as the variation in responses. To understand the range of opinion, one should interpret the mean in conjunction with the shape and frequency of responses along the scale. Generally, differences that are less than .5 above or below the mean should be regarded as functionally equivalent.
A standard deviation for a question greater than 1 indicates relatively high differences of opinion; in such cases, comments can be particularly useful to help understand the variation.
If follow-up analyses are carried out on the data, do not look beyond 1 decimal place. Factors that have a statistically significant impact on course ratings do not usually result in meaningful differences.
This is because they can provide insight into why some students had difficulty learning or, conversely, why others succeeded. Written comments often help clarify and illuminate some of the observed numerical response patterns. (See the section below on Interpreting Students’ Written Comments.)
To help derive the most benefit from your results, we encourage you to discuss them with a trusted colleague, your academic unit head or someone from Teaching and Learning Services (TLS).
Use this template to report on a specific course or course over time; simply download the file and enter the data in the appropriate cells. Note that there are multiple sheets (tabs) in this document. View the Guidelines for Interpretation for additional recommendations on how to report numerical results (specific course, specific term, and patterns over time).
Making sense of students’ written comments can be a daunting task; however, comments provide the insights and richness that help in understanding and interpreting student feedback. Approaching the comments in a systematic way can make the process easier and more meaningful.
Comments concerning clarity and difficulty, teaching strategies, course activities, assignments and assessments address areas that the instructor has the most opportunity to adjust and improve. For example, the comment: “He should present the material in a more structured and organized manner,” refers to course design and organization, aspects that the instructor can address.
Comments that fall in this area often reflect a shared responsibility between the instructor and the students and include topics such as interest and communication. For example a student’s course experience that elicits the comment: “Some students were just not interested in learning the material of this course” may have just as much to do with their motivation to learn in this area as it has to do with the instructor’s ability to facilitate an interesting course. An open discussion with students can help identify how these areas may be improved.
Comments related to organization and structure as well as the physical environment often require a concerted reaction from the instructor and the program administrator (i.e., Dean, Chair or Director). For example, the comment: “This course should be open to students in their first year” should be brought to the attention of the administration for consideration in program design.
Comments about the personal traits (for example, accent or apparent unfriendliness) of the instructor understandably often elicit strong emotions. These should be reflected upon and where appropriate and possible, potential strategies should be discussed with a trusted colleague or teaching support specialist.
This document helps instructors make sense of students' comments and provide a framework for making decisions about appropriate next steps. This document contains the comments analysis worksheet.
McGill University is on land which has served and continues to serve as a site of meeting and exchange amongst Indigenous peoples, including the Haudenosaunee and Anishinabeg nations. Teaching and Academic Programs acknowledges and thanks the diverse Indigenous peoples whose footsteps mark this territory on which peoples of the world now gather. This land acknowledgement is shared as a starting point to provide context for further learning and action.