This page contains a summary of the Guidelines and Recommendations for the Interpretation of End-of-Course Evaluation Results [.pdf].
As part of their repsonsibilities as academic administrators, academic unit heads should discuss course evaluation results with instructors in the annual review process. The academic unti head should regularly review all numerical results and comments, especially for pre-tenure instructors. Course evaluation results, both numerical and written, can also be useful in the merit process. Feedback from courses within programs can also be useful to identify program strengths as well as curricular or other changes that may be warranted.
-
Guidelines for Interpreting Unit Results
-
Definitions Used in the Course Evaluation System
-
Other Resources
Guidelines for Interpreting Unit Results
It is often tempting to look at the means and identify ratings below the mean as problematic. However, this can lead to oversimplified results that mask useful information. In addition to the guidelines for instructors, the following points should be kept in mind by unit heads when reviewing results:
Avoid ranking instructors from "best" to "worst" based on course ratings.
Even with a group of excellent instructors, rankings will present strong instructors as being "below average." Rankings by default diminish the accomplishments of some instructors, even if all are excellent teachers.
An instructor who may be below the unit mean in a unit with a strong teaching culture may still be teaching well.
Consider the entire pattern of results.
To form a comprehensive and meaningful understanding of an individual's teaching, it is important to consider the entire pattern of results from a number of different courses and classes of students over a period of time.
Research suggests that data should be reviewed from courses every term for at least two years, totalling at least five courses.
If comparisons are made, the comparison group should be identified so as to be meaningful.
In many academic units, there are different forms used for different types of courses; e.g., labs, seminars, undergraduate vs. graduate. As the means are calculated separately for each questionnaire in use in your unit, the comparator group is automatically generated.
When a course is a section of a multi-section offering, the other sections of the course are a good starting point. As well, courses of the same level within the Faculty can help contextualize results.
Note that when comparisons are made, it is important to safeguard the confidentiality of results of the comparison group.
The mean is not sufficient to provide a picture of the distribution of responses.
When interpreting the numerical results, consider information such as the distribution of responses by item as well as the variation in responses. To understand the range of opinion, interpret the mean in conjunction with the shape and frequency of responses along the scale.
Generally, differences that are less than .5 above or below the comparison mean (department, Faculty level, or class size) should be regarded as functionally equivalent.
Ratings of global items are the most useful as indicators of overall instructional effectiveness.
(e.g., “Overall this instructor is an excellent teacher”; “I learned a great deal from this course”). Responses to these questions are found to correlate most consistently with measures of actual student achievement. How an individual instructor compares to the departmental mean is actually less important than the overall rating. It is reasonable to strive to have all instructors and courses obtaining solid or strong results, but not everyone can be above average.
Generally, mean scores over 4 are considered strong, means from 3.5 to 4 represent solid results, and results below 3.5 should be of concern. As well, it is advisable to follow-up on any result that is more than .5 below or above the comparison mean (department, Faculty by level or class size).
| Rating | Meaning (in general) |
|---|---|
| < 3.5 | Of concern |
| 3.5 - 4 | Solid |
| > 4 | Strong |
The standard deviation provides important additional information about the variability of student responses.
A standard deviation for a question greater than 1 indicates relatively high differences of opinion; in such cases, comments can be particularly useful to help understand the variation.
Mercury results are reported to only 1 decimal place to avoid overemphasis on differences that are not meaningful.
If follow-up analyses are carried out on the data, do not look beyond 1 decimal place. Small differences that are statistically significant are common with large sample sizes. As a result, it is important to ask whether the difference is large enough to have practical implications.
For example, if two instructors in a department receive average ratings of 4.7 and 4.8 on the question "Overall, this instructor is an excellent teacher"; it would be difficult to argue that the difference of 0.1, although it might be statistically significant, is large enough to claim that the instructor with a rating of 4.8 is a better teacher.
Written comments provide extremely useful insights for formative purposes.
The Comments Analysis Worksheet is a tool to summarize comments to facilitate analysis.
- Focus on specific, descriptive items and look for patterns. Specific teaching behaviours (e.g., clarity of objectives) are easier to change than personal characteristics (e.g., enthusiasm).
- Consider ratings in relation to written comments to see if the latter provide indicators and suggestions for improvement.
- If there is considerable variation in response on an item (e.g., some report assignments as appropriately challenging and others as too challenging), it may represent important differences in the nature of the students (e.g., senior versus first year, or an uneven distribution of background preparation for the course).
Encourage instructors to use the Sample Tables for Reporting of Results (.xslx) to report the numerical results of specific courses and courses over time as well as the Comments Analysis Worksheet (.docx) to help organize and make sense of written comments.
Return to top.
Definitions Used in the Course Evaluation System
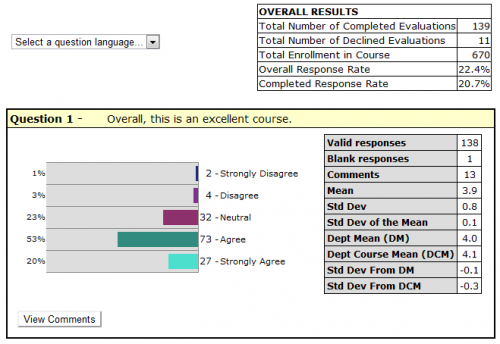
Data for Overall Results
Total Number of Completed Evaluations
The number of students who submitted the evaluation.
Total Number of Declined Evaluations
The number of students who declined the evaluation.
Total Enrollment in Course
The number of students enrolled in the course.
Overall Response Rate
The sum of the “Total Number of Completed Evaluations” and the "Total Number of Declined Evaluations," divided by the “Total Enrollment in the Course or Course Section," expressed as a percentage.
Completed Response Rate
The “Total Number of Completed Evaluations” divided by the “Total Enrollment in the Course or Course Section," expressed as a percentage.
Data for Individual Questions
Valid responses
The number of students who selected one of the options provided for the question.
Blank responses
The number of students who did not select an option for the question. Blank responses are NOT included in any calculations. Note: The number of “Valid responses” plus the number of “blank responses” should equal the “Total Number of Completed Evaluations”.
Comments
The number of students who entered a comment for the question.
Mean
The sum of all “valid responses” divided by the number of “valid responses”. Note: The closer the mean is to 5, the closer it is to “strongly agree/ excellent”.
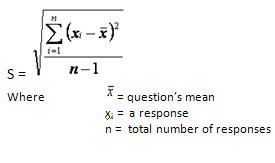
Standard Deviation
The standard deviation is a measure of the variation of the distribution of a data set. The standard deviation provides information about the distribution of responses, and underlines the danger of looking at the mean alone without considering the variance.
Formula: The standard deviation is calculated as the square root of the arithmetic mean of the squares of the deviation from the arithmetic mean. As this is a calculation on a sample rather than the population, the result is an estimated standard deviation and is expressed in the same units as the data.
Why look at the Standard Deviation?
For example, the following three cases illustrate how the same mean, 3, summarizes three data sets with completely different features. Clearly, the estimated standard deviation is needed in conjunction with the sample mean to better describe a data set.
| Case 1 | Case 2 | Case 3 |
Student responses: 5 x “1” and 5 x “5”
|
Student responses: 2 x “1”, 2 x “2”, 2 x “3”, 2 x “4” and 2 x “5”
|
Student responses: 10 x "3"
|
Standard Deviation of the Mean
This is an estimate of how representative the sample mean (those responding to the questionnaire) is of the population mean (the whole class).
Formula: The variability of the sample mean is, naturally, smaller than the variability in the individual observations. This is usually taken to be the estimated standard deviation of the observations, divided by the square root of the sample size. When sampling from a “small” finite population this variability will be reduced. A finite population estimator of the standard deviation of the sample mean is given by:
Department Mean
This is the mean calculated treating all courses as if they were combined into one. It is the sum of all valid responses for a question in all courses in the department divided by the total number of such responses.
Department Course Mean
This is calculated as the “mean of means” and gives equal weight to mean evaluations from classes of different sizes. For this mean, the sum of the mean for each question per course is divided by the number of courses. It is calculated to avoid any weighting due to large courses in a department but perhaps gives undue weight to mean evaluations reported for classes with very small enrolments.
Do I use the Department Mean or Department Course Mean?
The decision about which mean to use depends on the course size and number of respondents. The Dept. Mean is more commonly used when there is little difference (+-.1) between the two means. This usually occurs when courses within a department have relatively uniform enrolments and there are similar response rates for all courses.
However, a range of course sizes or number of respondents within a department usually results in differences between the two means. Therefore, to compare like to like, large courses should be compared to the Dept Mean and small courses to the Dept Course Mean.
For example, Dept X has enrolments ranging from 6 to 400. For a given semester, the question, “Overall, this is an excellent course,” gives a Dept Mean of 3.4 and a Dept Course Mean of 3.7.
Case 1
Prof. A is teaching a course of 28 students and received 15 responses (53.6% response rate). The result for this question was a mean of 4.1, σ 0.9. To compare to similar smaller courses, the Dept Course Mean should be used, as this removes the weighting due to the number of students in large classes.
Case 2
Prof. B is teaching a course with 400 students and received 149 responses (37.3% response rate). The result for this question was a mean of 3.2, σ 1.0. To compare to similar large courses, the Dept Mean should be used, as this removes the weight of courses with small enrolments.
Return to top.
For more information on interpreting course evaluation results, please consult with an Academic Associate at Teaching and Learning Services.
Return to top.