Explains the phenomenon of seasons in terms of the position of the Earth with respect to the Sun (tilt, revolution)
Students’ alternative conceptions/framework of season:
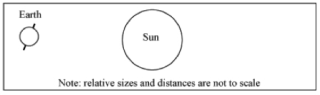
In summer the earth is closer to the sun, which explains differences in seasons.
The earth’s orbit is highly elliptical.
Clouds are thicker in the winter.
Seasons are caused by the earth’s proximity to the sun.
When students understand the concept of the earth’s tilt, they could not explain how the tilt was responsible for the seasons.
The earth’s orbit is elliptical and therefore the Earth is further away from the Sun in the winter.
Seasons are caused by the alignment of the Earth with the sun and the moon.
Seasons are caused by the direction of the Sun’s rays, but there is no mention of the Earth’s tilt.
In winter the Earth faces away from the Sun. Students confuse winter with night.
Reference:
Barrier, R. M. (2010). Astronomical Misconceptions. Physics Teacher, 48(5), 319–321.
Thomas, J. D. (2011). The Reasons for the Seasons. Science Teacher, 78(4), 52–57.
Wilcox, J., & Kruse, J. (2012). Springing into Inquiry: Using Student Ideas to Investigate Seasons. Science Scope, 35(6), 26–31.
Assessment Item(s) to explore/uncover preconceptions around this concepts (select from the diagnostic items table):
Question 1. Which of the following statements is TRUE about the number of hours of daylight at the North Pole and at the equator compared to everywhere else on earth?
A. The equator always has the most hours of daylight. The North Pole always has the least.
B. The North Pole always has the most hours of daylight. The equator always has the least.
C. Sometimes the North Pole has the most hours of daylight, and sometimes it has the least. The equator has the same number of hours of daylight every day.
D. The number of hours of daylight on any given day is the same everywhere.
(Developed by the Chantier 7 project team)
Question 2. The diagram below shows the earth with its axis of rotation pointed toward the sun.
Which of the following diagrams show the correct position and tilt of the Earth six months later?
Question 3. The two diagrams below show the Earth on two different days. A student lives at the place indicated by the arrow.
Assuming that the sky above her is cloudless on both days shown above, on which day is sunlight more intense where she lives?
A. Sunlight is more intense where she lives on the day shown in Day 1.
B. Sunlight is more intense where she lives on the day shown in Day 2.
C. Sunlight has the same intensity where she lives on both days.
D. There is not enough information provided to determine on which day sunlight is more intense where she lives.
Activities to promote conceptual change about seasons
Article title
Springing into Inquiry: Using Student Ideas to Investigate Seasons
Study focuses on the following scientific concepts
Season
Grade Level/s (focus on Grades 6 – 9)
Secondary level
Activities/interventions used in the study to foster learning or conceptual change
The purpose of this study is to provide concrete examples of how Inquiry Based Learning can be used to teach the concept of seasons, while addressing student alternative conceptions about seasons. For example:
Students drew the path of the earth around the sun
Students evaluated annual temperature data from 6 locations around the North and South Hemisphere
Students drew temperature graphs of same six locations?
Students shone a flashlight on a whiteboard directly and indirectly and then asked to explain differences in temperature
Think pair share and write pair share
Comparison of students drawings of the seasons before and after instruction
Summative assessments using verbal exams or open-ended essay questions were used to assess students’ understanding of seasons during and after the lesson.
Probing questions used in the lessons included the following:
What would the path of the Earth around the Sun look like? This question, and the next questions address the common misconception about distance from a heat source.
If Earth is closer to the Sun in the summer, which part of Earth would be experiencing summer?
If Earth is farther away from the Sun in the winter, and all parts of Earth would be in their winter months, how can the seasons be opposite in the Southern Hemisphere?
Can both of these statements be true?
The following questions delve deeper into the issue of proximity:
How does annual temperature vary at different places around the world?
Does distance from the sun explain changing seasons?
How does amount of sunlight vary for different seasons?
What is the difference of sunlight when the poles are compared to the equator?
How is sunlight different in the four seasons?
Next, there is a demonstration using a globe in the light of an overhead. Questions such as these follow:
What parts of earth receive the most direct light? What is the annual temperature in these regions?
Referring to the globe demonstration, students are asked: Why are the poles of the planet so cold? What is the different when Earth is on the other side of the Sun?
Citation
Wilcox, J., & Kruse, J. (2012). Springing into Inquiry: Using Student Ideas to Investigate Seasons. Science Scope, 35(6), 26–31.
Article title
The Reasons for the Seasons
Study focuses on the following scientific concepts
Season
Grade Level/s (focus on Grades 6 – 9)
Secondary level
Activities/interventions used in the study to foster learning or conceptual change
This article uses Inquiry Based Learning to address causal misconceptions about seasons. A seven-step instructional strategy is employed.
(1) Present a scenario with an unknown outcome. For example, what are some factors that could explain the changes in seasons?
(2) Students predict an outcome.
(3) Students develop explanations to support predictions.
(4) Students observe the outcome using the discrepant data.
(5) Students to modify explanations.
(6) Students evaluate explanations.
(7) Students repeat steps with different data, for example, for other cities or regions in the country or globally.
Day 1: Predicting seasonal temperatures
Students analyze the mean monthly high temperatures from multiple cities. Data is gathered from the Weather Channel. Using a graphic organizer students summarize their findings, and make conclusions based on group discussions. Students tested their hypothesis of one variable using Internet climatology sites, organized their data and made evidence based conclusions. Inquiry Based questions included:
Rank the cities from coldest to warmest. Why did you rank them this way?
Predict the month-to-month temperature trends among the cities. Why did you make these predictions?
What differences in temperature between the coldest and the warmest month do you predict? Why did you make these predictions?
On a scale of 1–10, how would you describe your confidence that your predictions are accurate? Explain your answer.
Day 2: Collecting seasonal data and evaluating predictions
Students collected and analyzed mean monthly high temperatures for the cities in their data tables using the internet. They compared their predictions with the actual data. Students are asked to explain two or three factors that would account for the differences. How is this activity different from the one described above?
Day 3: Hypothesizing and planning procedures
Seasonal trends are written on the board. Students record the factors they have identified, (distance from the Sun, angle of the Sun, duration of sunlight proximity to the equator, and the angle of the Earth’s tilt brings us closer to the Sun). Students choose one factor in small groups, and then explain the factors. Students collect data from the internet. Guiding questions include:
What data must be collected (e.g. angle, distance)?
What time interval will you use to sample the data (monthly, weekly, daily)?
How does time of day affect the data (noon, midnight)?
What is the ideal time of day to collect the data? Why?
What are the units of measurement?
What type and format of data tables are best suited to present the results?
What type of graph is best suited to present the results?
The example in the article is as follows: To investigate how the angle of the Sun affects seasonal temperatures, data must be collected on the same day and at the same time of every month in order to correlate it with the seasonal temperature data. Data collection occurs in the computer lab.
Day 4: Organizing results
Students organized their data into tables and graphs, drew evidence-based conclusions, evaluated their hypotheses, and created a poster that was shared the following day.
Day 5: Sharing findings
Groups presented their posters.
Citation
Thomas, J. D. (2011). The Reasons for the Seasons. Science Teacher, 78(4), 52–57.